Among quantitative researchers, p-values are a much desired yet disputed topic. P-values help us by identifying the likelihood that two (or more) numbers in our research results would be different by chance, thereby allowing us to identify which products and services are preferred by consumers.
For example, let’s consider a package test wherein we want to determine whether the new and amazing new square package is better than the old and boring rectangle package. After going into field and collecting data, we learn that 40% of people like the square package and 50% of people like the rectangle package. And, let’s say that when we run a statistical test on that difference, we get a p-value of 0.05. This p-value means that we have a 5% chance of generating results like this if there is actually no differences in preferences between the square and rectangle. In plain (and not completely accurate) language, there’s a 5% chance that you actually found nothing.
P-values simplify the research world tremendously. Whether conducting ad tests, concept tests, pricing tests, or package tests, when we go through 200 pages of crosstabs to find differences among groups, the asterisks (*) instantly stand out and help us direct our attention to them immediately. It’s a quick and painless way to find 100 significant differences among 200 pages of densely filled numerical tables.

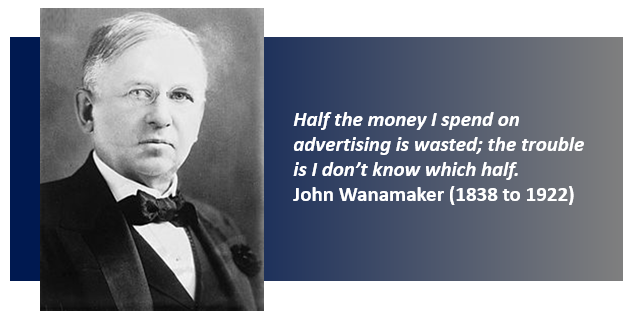
However, let’s remember a concept behind p-values – random chance could have made this happen. If we pick out 100 significant differences, we need to expect that random chance DID make at least some of them happen. Think about what John Wanamaker (1838 to 1922) famously said, “Half the money I spend on advertising is wasted; the trouble is I don’t know which half.” Well, that’s what we’re facing here. Five percent of the statistically significant differences are due to chance; the trouble is we don’t know which ones.
The problem with p-values is they can make you turn your brain off. They are so simple to use. You just check the box in your software and, ta dum, p-values magically appear with zero effort on your part. They are so simple to use that they might even be TOO simple to use. We’ve gotten so accustomed to searching out the asterisks and plugging those results into our already late presentation decks that we forget to apply brain power to them.

We forget to think about whether we had originally hypothesized that the differences we are reporting on would occur. Ideally, the only relationships that we should be applying statistical tests to are the ones that we had planned in advance to test. No one generates a hypothesis about each one of the thousands of potential combinations of variables in a questionnaire even though we test every single combination.
We forget to think about whether the magnitude of difference for a significant difference is truly meaningful and will have an actionable outcome. For instance, in the case of health care and social services, a statistically significant difference of 3 to 5% is hugely meaningful. When 40% of people in the placebo group live and 43% of people in the test drug group live, that 3% difference could save hundreds or thousands of lives.
But in the case of research with consumer packaged goods, small effect sizes won’t necessarily translate into increased profits. Creating a completely new product SKU to appeal to the 40% of people who would prefer the square package vs the 43% of people who prefer the rectangle package could cost more than it brings in – new sourcing, new production lines, new packaging, new advertising. And, we still don’t know if the preference for the rectangle package was the result of random chance. All that effort could be money down the drain.
There is a healthy compromise though. Yes, continue to use p-values as a quick way to identify large differences within the data. But make sure that, at the same time, you turn on your brain. Think about whether you genuinely expected to see that difference before you knew it was statistically significant. Think about whether the difference is large enough to be meaningful. Think about whether the difference is actionable and worthwhile to be actioned.
We can’t continue to be passive consumers of p-values. When a statistically significant difference is determined to be meaningful and actionable, replicate the finding with a different sample, a different data collection tool, or in a different location. Prove that the significant result was not the result of chance.
Let’s be active users of p-values.


