Tag Archives: analysis

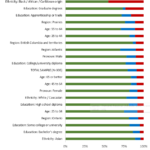
79% Feel Positively About Diversity and Inclusion in Canada. It’s Just Not Evenly Distributed.

The Canadian Viewpoint team has been paying very close attention to the protests both around the world and in our home town, Toronto, Canada. 57% of our team members are visible minorities compared to 52% of people in Toronto so […]

What is a Booster Sample in Marketing Research Studies and When Should You Use One?

  “Additional interviews involving a particular sub-group of a sample to ensure there are sufficient members of the sub-group in the resulting sample.” – Insights Association glossary Let’s consider an example. Suppose you are conducting a nationally representative study of […]

Nudge, nudge: An effective psychological technique for improving human behaviour (and selling more stuff)

  It can be really hard to ‘make’ people do things. Chances are, when you ‘make’ them do something, it’s because they don’t actually want to do it and they may try to avoid doing it. So how can we […]

Marketing Research Calculators from T-Tests and Chi-Squares to Power and Effect Sizes

For those of us who analyze quantitative marketing research data with statistical packages like SPSS, SAS, and R, there is little need to find an online calculator. But every once in a while, you might find yourself with a little […]

How To Clean A Marketing Research Questionnaire Dataset

  Depending on who you talk to, cleaning market research data files for use with advanced statistical analyses takes between 50% and 95% of the total time spent working on a dataset. It’s the only way to ensure that the […]

Five Quick Tips For Effective Use of Marketing Research Data Tabulations

Data tables can be intimidating. A questionnaire of moderate length can have hundreds of columns and thousands of rows to wade through. At the same time, tables generally incorporate extremely valuable features that save researchers a lot of time. But […]

Focus Groups Are Better Than Biometrics for Marketing Research

Yes, that’s a clickbait title. It’s also a very common and genuine sentiment. If you run a quick search on Twitter for “better than focus groups,” you can see that they take a lot of heat for not being the […]

Decreasing Data Precision to Achieve Increased Sample Sizes: A bold, wise move from Statistics Canada

Statistics Canada recently announced a trial usage of Random Tabular Adjustment, RTA in their publicly released datafiles (read the academic paper by Mark Stinner here). RTA is a fancy name for a fairly simple process that will give external researchers […]

Research and Analytics Dashboards: From Idea to Design

As delightful as a 100-page report is, especially when it’s tracker results delivered 4 or more times per year, sometimes creating a custom dashboard is the only logical way to present research results. A well-designed dashboard makes it vastly easier […]

U&A&H&P: What are the key components to learn about consumers, customers, and category users?

The words are different but the application is the same. Usage and Attitudes studies, also called Habits and Practices studies, help researchers and marketers understand consumers and customers in order to build and innovate products and services. They are an […]