Market research reports and dashboards are full of numbers and terms. If you aren’t completely clear on the terms, it can be nearly impossible to understand which results are genuinely important. Let’s try to understand things better by going through each term one at a time. Get your calculators (or Excel sheets) out so you can follow along.
Percent: A percent is used to represent how often something occurs out of every 100 cases. Many of us are used to percents from our tests and report cards in school. If you were a good student, you’d get 97% of answers to a test correct. The rest of us would just hope for a percentage over 60%.
In the case of market and social research, percents are often used to describe group composition and opinions. What percent of your sample is lives in Quebec? What percent of women like a certain product?
The calculation is as follows. If there are 90 people in a sample and 37 of them are men, then 41% of the people in the sample are men. (37 / 90 * 100 = 41%)

Percentage point: In this case, you might want to know the difference between percent numbers. Using percentage points is the simplest way to do this. Calculate the difference between the two percents.
There is a four percentage point difference between 36% and 40%. (40 – 36 = 4).
There is a five percentage point difference between 15% and 10%. (15 – 10 = 5).
There is a one percentage point difference between 5% and 4%. (5 – 4 = 1).
For example, if 36% of men like Product A, and 40% of women like Product A, there is a four percentage point difference between men and women in terms of how much they like Product A. It is a four point difference.
Percent larger: Now comes the tricky part! How much larger is 5% compared to 4%? It is NOT simply 1% larger.
In fact, 5% is 25% larger than 4%. ((5 – 4) / 4 * 100 = 25%)
And, 15% is 50% larger than 10%. ((15 – 10) / 10 * 100 = 50%)
If 37% of women like Product A and 36% of men like Product A, 2.7778% more women like Product A.
Percent smaller: Conversely, how much smaller is 4% compared to 5%? Again, 4% is NOT 1% smaller than 5%.
4% is 20% smaller than 5%. ((5 – 4) / 5 * 100 = 20%).
And, 10% is 33% smaller than 15%. ((15 – 10) / 15 * 100 = 33%).
If 36% of men like Product A and 37% of women like Product A, 2.7% fewer men like Product A.
Ratios: A ratio describes the relationship between two numbers in terms of how many times one of the numbers is contained within the other.
Thus, the ratio of 4% to 5% is 80% (4% / 5% * 100 = 80%). The 4 takes up 80% of the space of 5.
Conversely, the ratio of 5% to 4% is 125% (5% / 4% * 100 = 125%). The 5 takes of 125% of the space of 4.
The ratio of 36% of men liking Product A to 37% of women liking Product A is 97.29%.
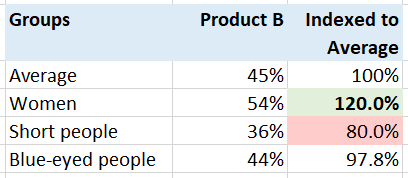
Indexes: Finally, an index is a form of ratios. It’s typically designed so that a series of numbers are ‘indexed’ against the same comparison number. These numbers are sometimes colour coded so that you can quickly identify which subgroup indexes higher or lower than average.
Let’s say that on average 45% of people like Product B.
If 54% of women like Product B, then that group indexes 120% against average (54% / 45% * 100 = 120%).
If 36% of short people like Product B, then that group indexes 80% against average (36% / 45% * 100 = 80%).
If 44% of blue eyed people like Product B, then that group indexes 98% against average (44% / 45% * 100 = 98%).
Hopefully, that’s as clear as mud but if you want some help reading your reports, please get in touch with us!

